Next: Asymptotic approach Up: Implementation Example Previous: Analytic approach
It is possible to utilise Monte Carlo integration using Markov Chains (MCMC) to
obtain inference about population statistics in many problems. An MCMC solution
to a problem consists of an MCMC constructed so that its stationary distribution
is the distribution about which it is wished to draw inference, (see, for
example, Gilks et al., 1996). The problem outlined in section 2 is
amenable to this approach. Specifics of the method used are discussed in
![]() .
.
As a simple example of the use of MCMC to solve the above problem choose a Metropolis-Hastings, random walk MCMC. This has the advantage of allowing the use of a symmetrical distribution from which to choose the candidate.4 Once the process has entered the state space of the target distribution5 it will not leave it.
Here
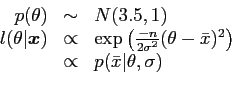 |
(32) |
so the probability of transition from ![]() the current state to
the current state to
![]() the candidate state is
the candidate state is
 |
(33) |
The code shown in figure 2 is for running a Metropolis-Hastings,
random walk MCMC sampler. With the transition probability above, and allowing
1000 samples as a burn in period, the output is a sample of 1000 values with
![]() and
and
![]() . (Note that this result would, of
course, be slightly different if run again, due to the small sample used and
random differences. However, if a large enough sample is taken, run differences
tend to
zero with probability
. (Note that this result would, of
course, be slightly different if run again, due to the small sample used and
random differences. However, if a large enough sample is taken, run differences
tend to
zero with probability ![]() ).
).
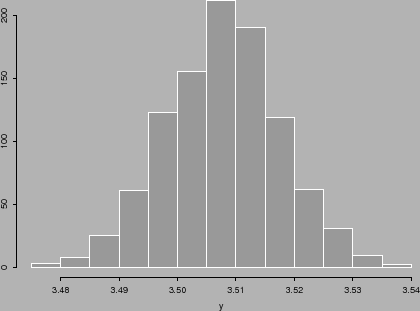
It is possible to draw a predictive sample from this density with the S-Plus
command y![]() rnorm(1000, samp, 0.01)6, where
rnorm(1000, samp, 0.01)6, where samp is the output from the
sampler, this gives the histogram shown in figure 1.
1
1.5
danny 2009-07-23
![\begin{figure}
\makebox[\textwidth]{\hrulefill}
\begin{verbatim}
function(th...
...fill}
\index{MCMC ! example S-Plus code}
\index{S-Plus ! MCMC}
\end{figure}](img119.png)